
本レポートでは、テクニカル分析の手法を用いて様々な金融商品を分析している。本レポートには、ロングとショートの戦略の詳細な説明と、情報を理解するのに役立つ視覚的なチャートが含まれています。しかし、本レポートは財務アドバイスではなく、オックスシェアは投資家が本レポートに基づいて行った損失や決定について責任を負いません。投資家が投資判断を下す際には、自らの判断と経験に依拠するか、独立した助言を求めるべきである。
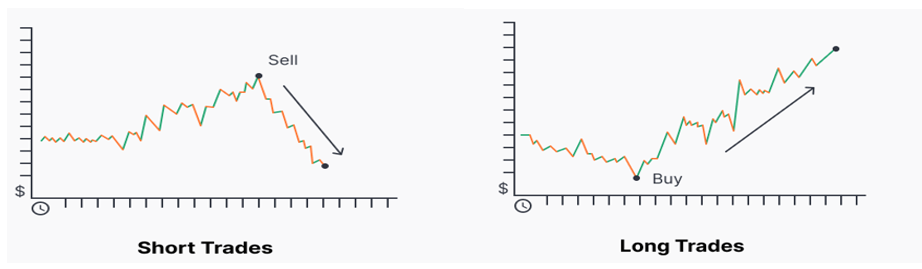
ロング:ロング」ポジションとは、トレーダーが後で利益を得て売却できるように、価格が上昇することを期待して資産を購入することを指す。
ショート:ショート」ポジションは、トレーダーが所有していない資産を売却することで、その価格が下落し、後で安い価格で買い戻し、利益を得ることを期待するものである。
TP1: は利益を取る最初のライン
TP2: は利食いまでの2行目
テクニカル分析:2025年1月24日
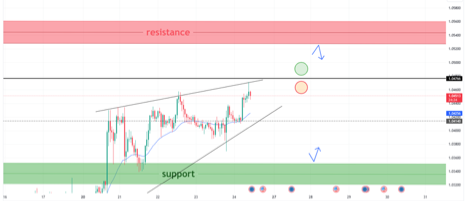
強気傾向
1.0476より上でクローズ
への傾きを示すポジティブな指標である。
| TP 1 | 1.0502 |
| TP 2 | 1.0526 |
1.0476以下で引ける
を導く負の指標である。
| TP 1 | 1.0429 |
| TP 2 | 1.0382 |
ポンド/米ドル分析
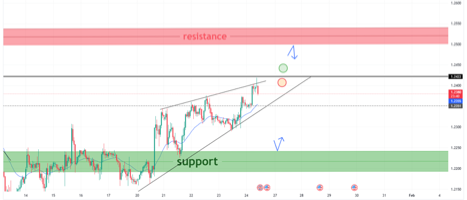
強気傾向
1.2422より上でクローズ
への傾きを示すポジティブな指標である。
| TP 1 | 1.2473 |
| TP 2 | 1.2503 |
1.2422以下で引ける
を導く負の指標である。
| TP 1 | 1.2342 |
| TP 2 | 1.2266 |
XAU/USDの分析
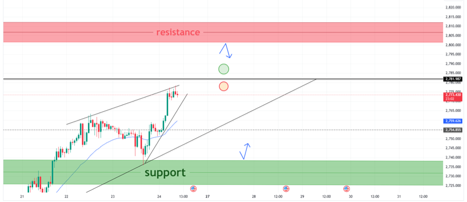
強気傾向
2781ドル以上で終値
への傾きを示すポジティブな指標である。
| TP 1 | 2793 |
| TP 2 | 2802 |
終値が2781を下回る
を導く負の指標である。
| TP 1 | 2763 |
| TP 2 | 2749 |

強気傾向
終値が44,647を上回る
への傾きを示すポジティブな指標である。
| TP 1 | 44,805 |
| TP 2 | 44,921 |
終値が44,647を下回る
を導く負の指標である。
| TP 1 | 44,452 |
| TP 2 | 44,235 |
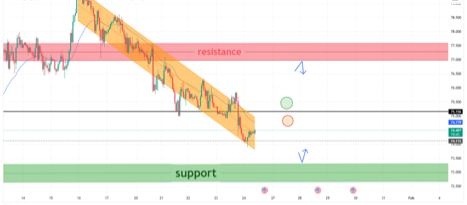
弱気トレンド
終値が75.15を上回る
への傾きを示すポジティブな指標である。
| TP 1 | 75.96 |
| TP 2 | 76.80 |
75.15を下回って引ける
を導く負の指標である。
| TP 1 | 73.84 |
| TP 2 | 73.29 |
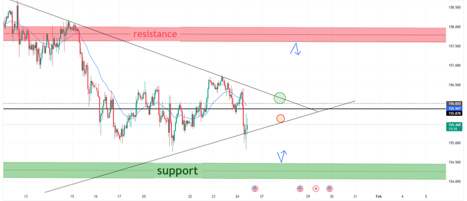
横に
155.87より上でクローズ
への傾きを示すポジティブな指標である。
| TP 1 | 156.68 |
| TP 2 | 157.38 |
155.87以下で引け
を導く負の指標である。
| TP 1 | 155.11 |
| TP 2 | 154.59 |
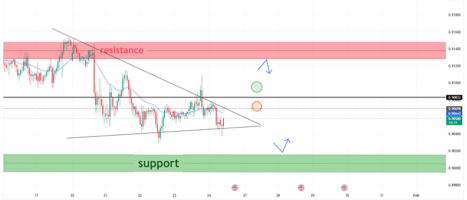
弱気トレンド
0.9083より上でクローズ
への傾きを示すポジティブな指標である。
| TP 1 | 0.9105 |
| TP 2 | 0.9124 |
0.9083を下回る
を導く負の指標である。
| TP 1 | 0.9057 |
| TP 2 | 0.9026 |
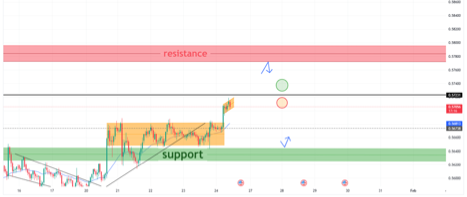
強気傾向
0.5723より上でクローズ
への傾きを示すポジティブな指標である。
| TP 1 | 0.5748 |
| TP 2 | 0.5768 |
0.5723を下回る
を導く負の指標である。
| TP 1 | 0.5680 |
| TP 2 | 0.5651 |

弱気トレンド
1.5873より上でクローズ
への傾きを示すポジティブな指標である。
| TP 1 | 1.5931 |
| TP 2 | 1.6034 |
1.5873より下でクローズ
を導く負の指標である。
| TP 1 | 1.5805 |
| TP 2 | 1.5745 |
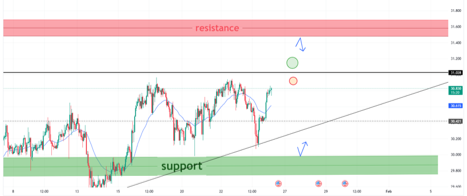
横に
終値が31.02を上回る
への傾きを示すポジティブな指標である。
| TP 1 | 31.23 |
| TP 2 | 31.47 |
終値が31.02を下回る
を導く負の指標である。
| TP 1 | 30.71 |
| TP 2 | 30.35 |
投資判断は、投資家自身の判断と経験に基づいて、またはファイナンシャル・アドバイザーからの独立したアドバイスを通じて行う必要があります。OXシェアは、意思決定に影響を与えることを意図した投資助言は提供していません。ここに記載された内容は一般的な情報であり、付随的なサービスや投資サービス、財務助言とみなされるべきではありません。本レポートは広範な分析を提供するものであり、個々の目的、財務状況、個人的状況、ニーズについては考慮されていません。投資を行う前に、ご自身の取引目標とリスク許容度を評価する必要があります。損失が許容できない資金には投資しないことをお勧めします。本レポートのデータおよび内容はすべて、独立した投資判断をサポートするためのものであり、個人的なアドバイスや推奨ではありません。本レポートに記載された見解や意見は、執筆者の視点を反映したものであり、必ずしもオックスシェアの姿勢を表すものではありません。オックスシェアは、投資家の投資判断に対する自由と責任を完全に保持するため、投資家の選択に対して責任を負いません。本出版物はオックスシェアの独占所有物であり、受領者のみを対象としています。無許可での配布や複製は禁じられており、本レポートの配布や複製を発見した個人または団体は、著作権侵害で追及されることになります。
ステップ1 登録
ステップ2 基金
EURUSD1.2184 1.2186
GBPUSD1.4167 1.4169
米ドル円109.35 109.38
USDCAD1.2101 1.2103
ステップ 3 トレード