

 English
  العربية
  Français
  Italiano
  Deutsch
  Русский
  简体中文
简体中文  हिन्दी
  বাংলা
বাংলা  Bahasa Indonesia
  اردو
اردو  Türkçe
  한국어
한국어  मराठी
मराठी 

This report analyzes different financial instruments using technical analysis techniques. It includes a detailed explanation of long and short strategies, along with a visual chart to help understand the information. However, this report is not financial advice, and Oxshare is not responsible for any losses or decisions made by investors based on the report. Investors should rely on their own judgment and experience or seek independent advice when making investment decisions.
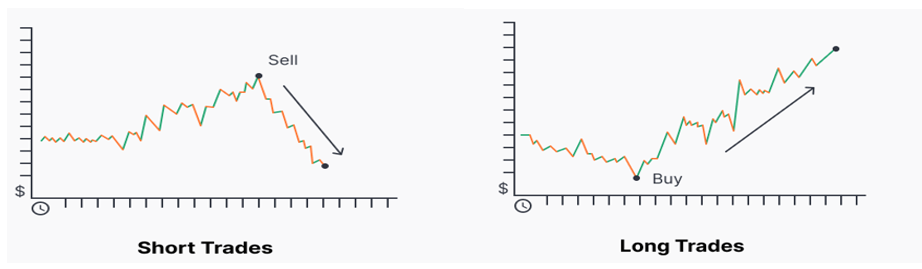
Long: A "long" position refers to buying an asset with the expectation that its price will rise, allowing the trader to sell it later at a profit.
Short: A "short" position involves selling an asset the trader doesn’t own, with the expectation that its price will fall, enabling them to buy it back later at a lower price for a profit.
TP1: is the first line to take profit
TP2: is the second line to take profit
Technical Analysis :
Sep 18, 2026
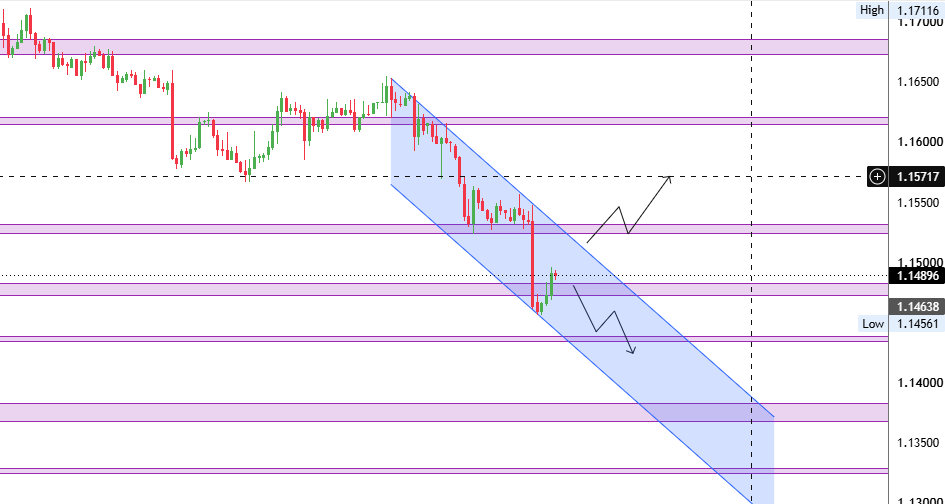
Bearish trend
Closes above:
1.15500
is a positive indicator for further incline towards
| TP1: 1.16500 |
| TP2: 1.17100 |
Closes below:
1.14500
is a negative indicator leading to
| TP1: 1.14000 |
| TP2: 1.13200 |
GBP/USD Analysis
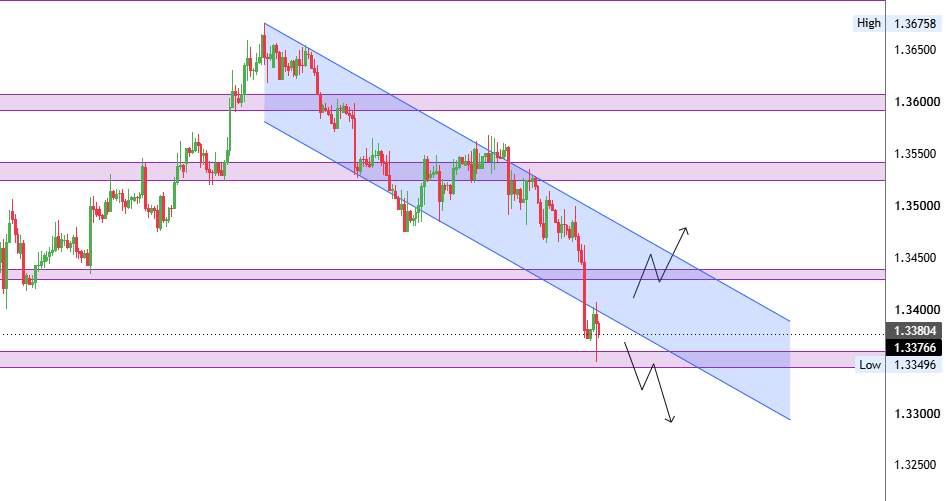
Bearish trend
Closes above:
1.34500
is a positive indicator for further incline towards
| TP 1: 1.35500 |
| TP 2: 1.36520 |
Closes below:
1.33500
is a negative indicator leading to
| TP 1: 1.33000 |
| TP 2: 1.32100 |
XAU/USD Analysis
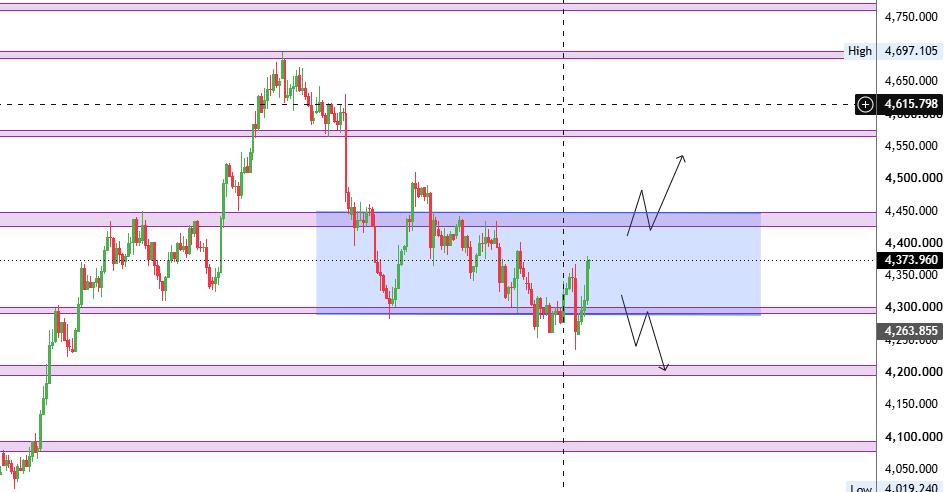
Bearish trend
Closes above:
4450
is a positive indicator for further incline towards
| TP1: 4488 |
| TP2: 4510 |
Closes below:
4200
is a negative indicator leading to
| TP1: 4170 |
| TP2: 4050 |

Bearish trend
First scenario
Closes above:
52.500
is a positive indicator for further incline towards
| TP1: 52.980 |
| TP2: 54.100 |
Closes below:
51.450
is a negative indicator leading to
| TP1: 51.150 |
| TP2: 50.500 |
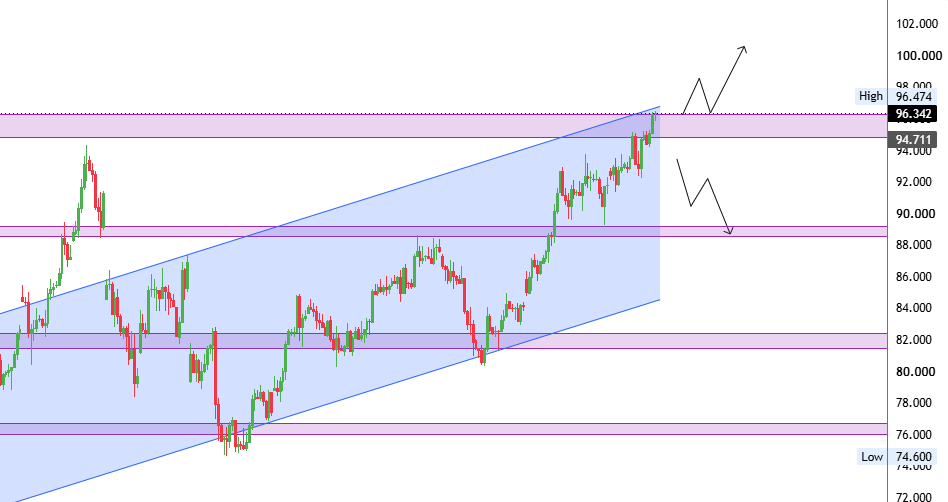
Bullish trend
Closes above:
105.000
is a positive indicator for further incline towards
| TP1: 105.950 |
| TP2: 106.500 |
Closes below:
97.500
is a negative indicator leading to
| TP1: 95.250 |
| TP2: 93.100 |
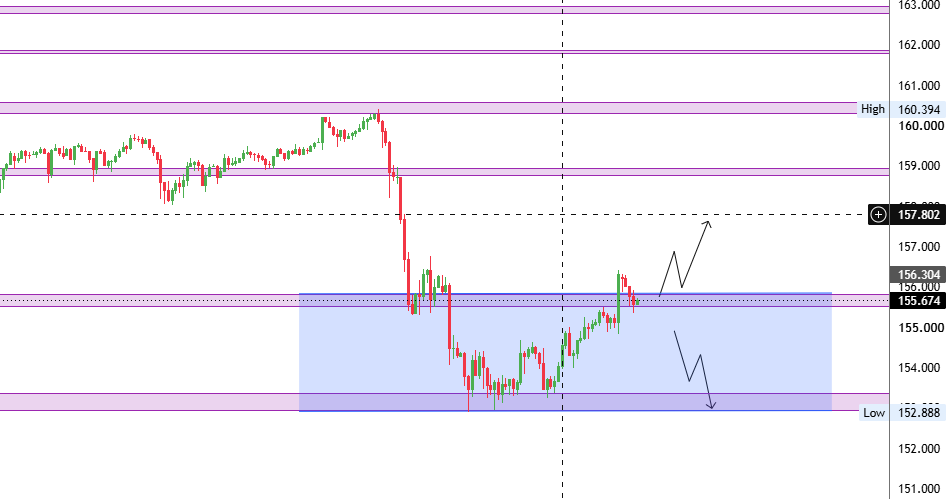
Sideway trend
Closes above:
156.350
is a positive indicator for further incline towards
| TP1: 157.100 |
| TP2: 158.500 |
Closes below:
152.888
is a negative indicator leading to
| TP1: 151.500 |
| TP2: 150.300 |

Bullish trend
Closes above:
0.82650
is a positive indicator for further incline towards
| TP1: 0.83000 |
| TP2: 0.84650 |
Closes below:
0.81500
is a negative indicator leading to
| TP1: 0.79750 |
| TP2: 0.78500 |
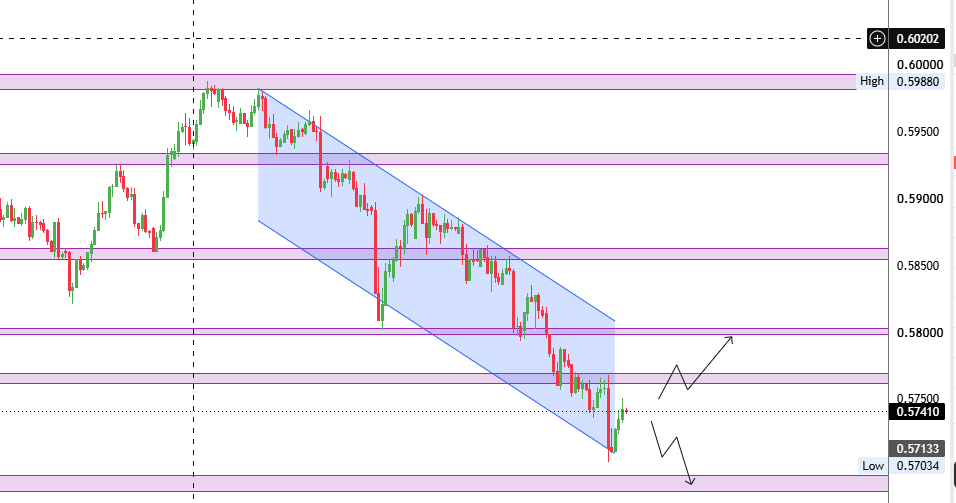
Bearish trend
Closes above:
0.58050
is a positive indicator for further incline towards
| TP1: 0.59030 |
| TP2: 0.60100 |
Closes below:
0.57043
is a negative indicator leading to
| TP1: 0.56500 |
| TP2: 0.55500 |
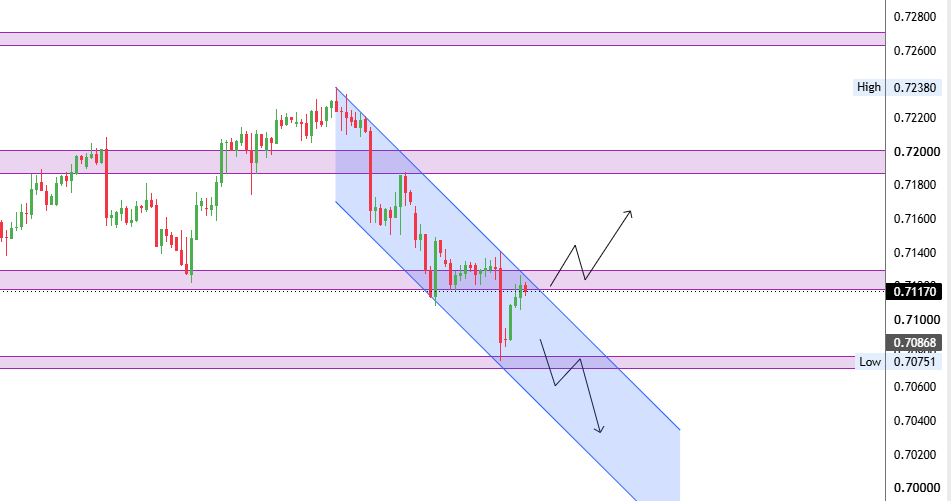
Bearish trend
Closes above:
0.71800
is a positive indicator for further incline towards
| TP1: 0.72500 |
| TP2: 0.73580 |
Closes below:
0.70500
is a negative indicator leading to
| TP1: 0.69700 |
| TP2: 0.68120 |
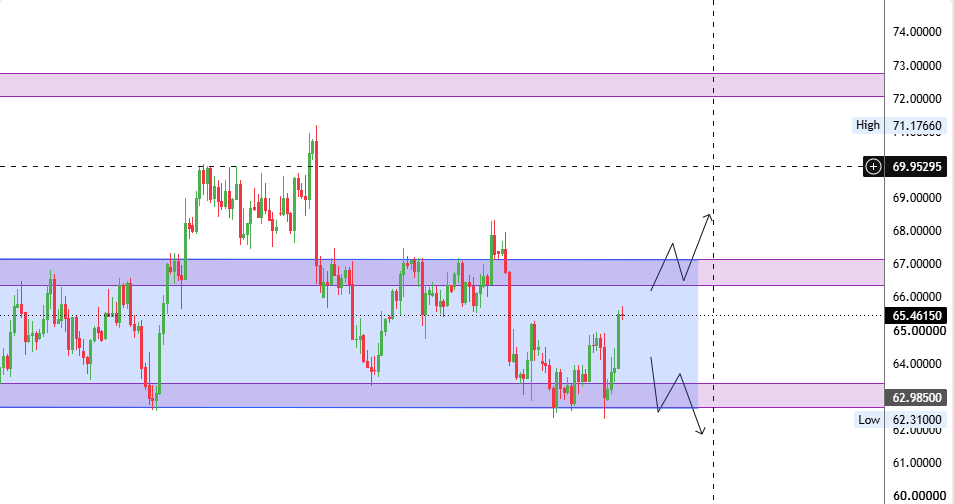
Sideway trend
Closes above:
67.500
is a positive indicator for further incline towards
| TP1: 69.550 |
| TP2: 71.250 |
Closes below:
62.520
is a negative indicator leading to
| TP1: 62.000 |
| TP2: 61.250 |
investment decisions should be made based on the investor’s own judgment and experience or through independent advice from their financial advisor(s). OXShare does not offer investment advice intended to influence decisions; the content herein is general information and should not be regarded as ancillary or investment services, nor as financial advice. This report provides broad analysis that does not consider individual objectives, financial situations, personal circumstances, or needs. Before investing, you should assess your own trading goals and risk tolerance; it is advised not to invest funds you cannot afford to lose. All data and content in this report are meant to support independent investment decisions and are not personal advice or recommendations. The views and opinions expressed in this report reflect the authors’ perspectives and do not necessarily represent OXShare’s stance. Oxshare is not liable for investors' choices, as they retain full freedom and responsibility over their investment decisions. This publication is the sole property of Oxshare and is intended exclusively for the recipient. Unauthorized distribution or reproduction is prohibited, and any individual or entity found distributing or reproducing this report will be pursued for copyright infringement