How Does it Work:
A likely scenario is proposed for today, and the probability of achieving this scenario according to technical analysis may be between 60% and 75%, but if the first scenario fails, here the probability of achieving the second scenario becomes between 60% and 75%.
The preferred scenario fails when the price reaches the level of the alternative scenario condition, and immediately gets triggered and cancels the prediction in the preferred scenario.
These reports are not considered a substitute for the trader's decision, but rather an aid to the follower in making his own decisions, as a reference based on the origin of classic technical analysis.
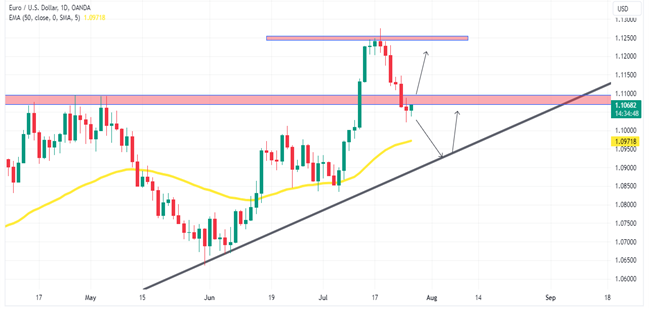
Bullish Trend
First scenario: rise to 1.1250 zone if the 4h candle closes above 1.1100.
Second scenario: if the 4h candle closes below 1.1090, this could trigger a fall towards 1.0971
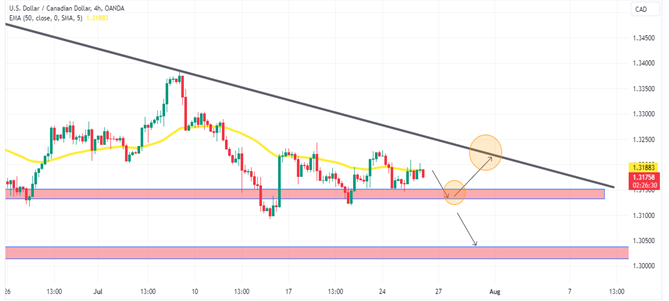
Bearish Trend
First scenario: fall towards 1.3050 area if the 4h candle closes below 1.3175.
Second scenario: retest for the trendline on 1.3225 level if the price holds above 1.3178.
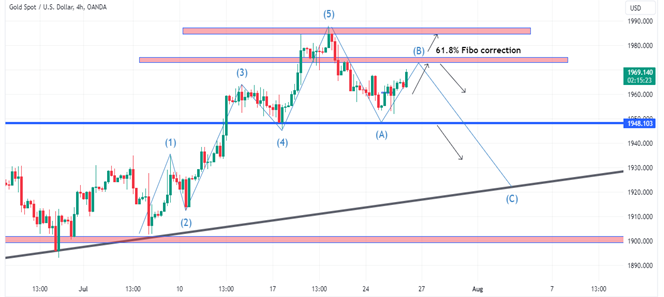
Bullish Trend
First scenario: rise to 1973 – 1975 if the price holds above 1960
Second scenario: bearish move towards 1948 – 1945 if the 4h candle holds below 1975
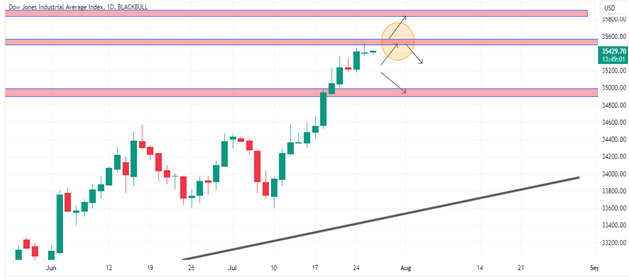
Bullish trend
First scenario: rise to 35800 if the price breaks the 35540 resistance.
Second scenario: if the 4h candle closes below 35400, this could trigger a fall towards 35160 area.
Bullish trend
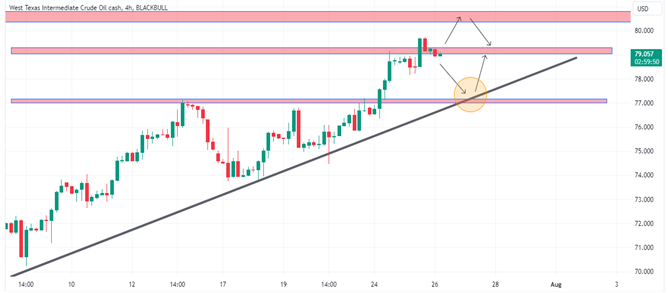
First scenario: rise towards support 80.3 area if the 4h candle closes above 79.3.
Second scenario: fall towards 77 if the price holds below 79.
Notice :
The analyzes and opinions contained in this report are not binding and are not considered recommendations to sell or buy, and the company is not responsible for the decisions and choices of the investor, and the aim of this report is to publish general information through technical analysis.

Step 1 Register
Step 2 Fund
EURUSD1.2184 1.2186
GBPUSD1.4167 1.4169
USDJPY109.35 109.38
USDCAD1.2101 1.2103
Step 3 Trade